
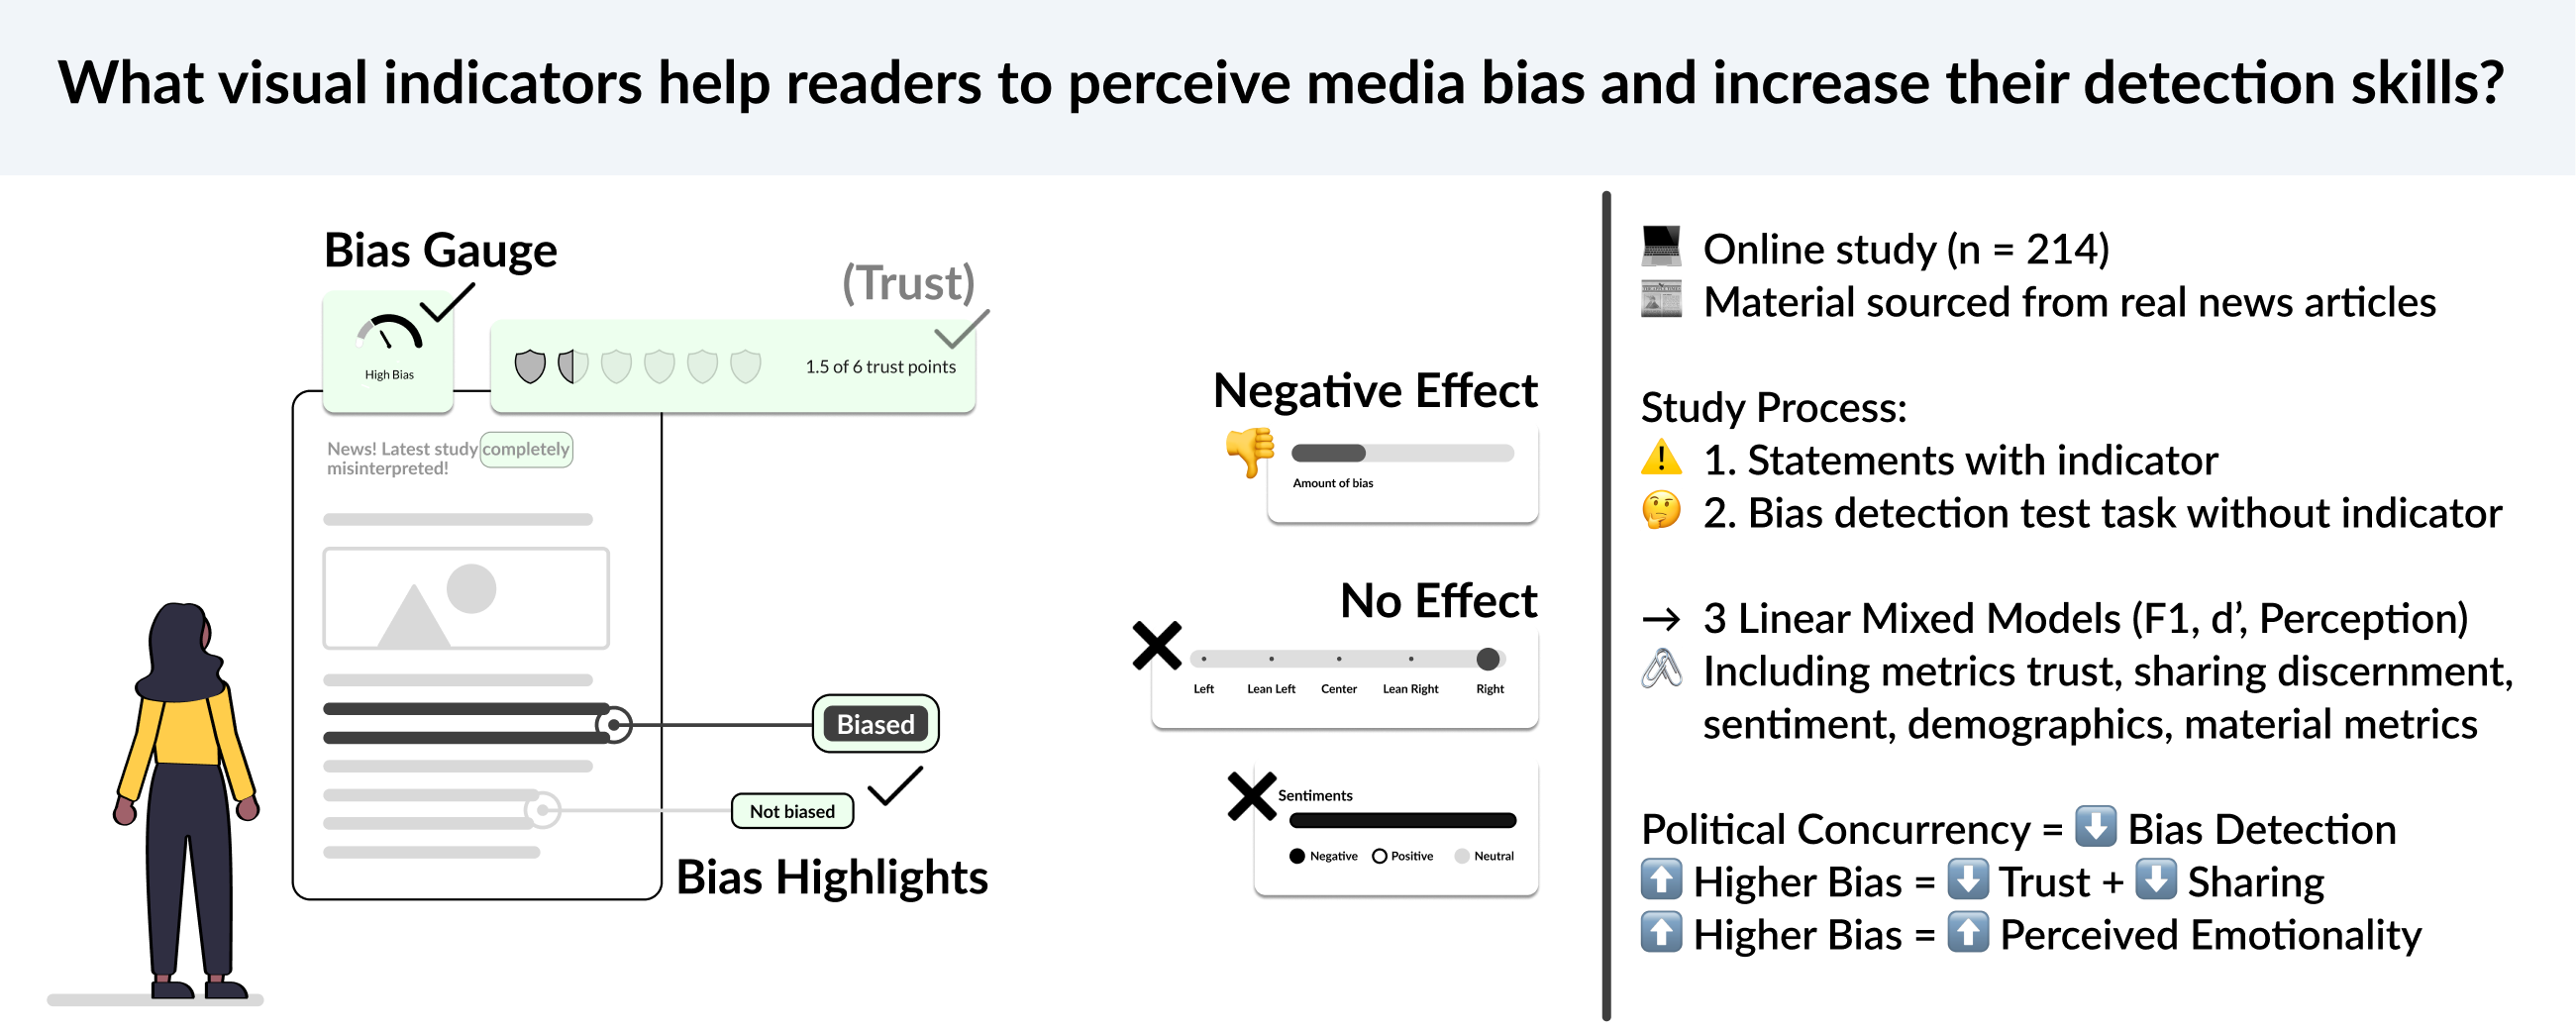
Highlights
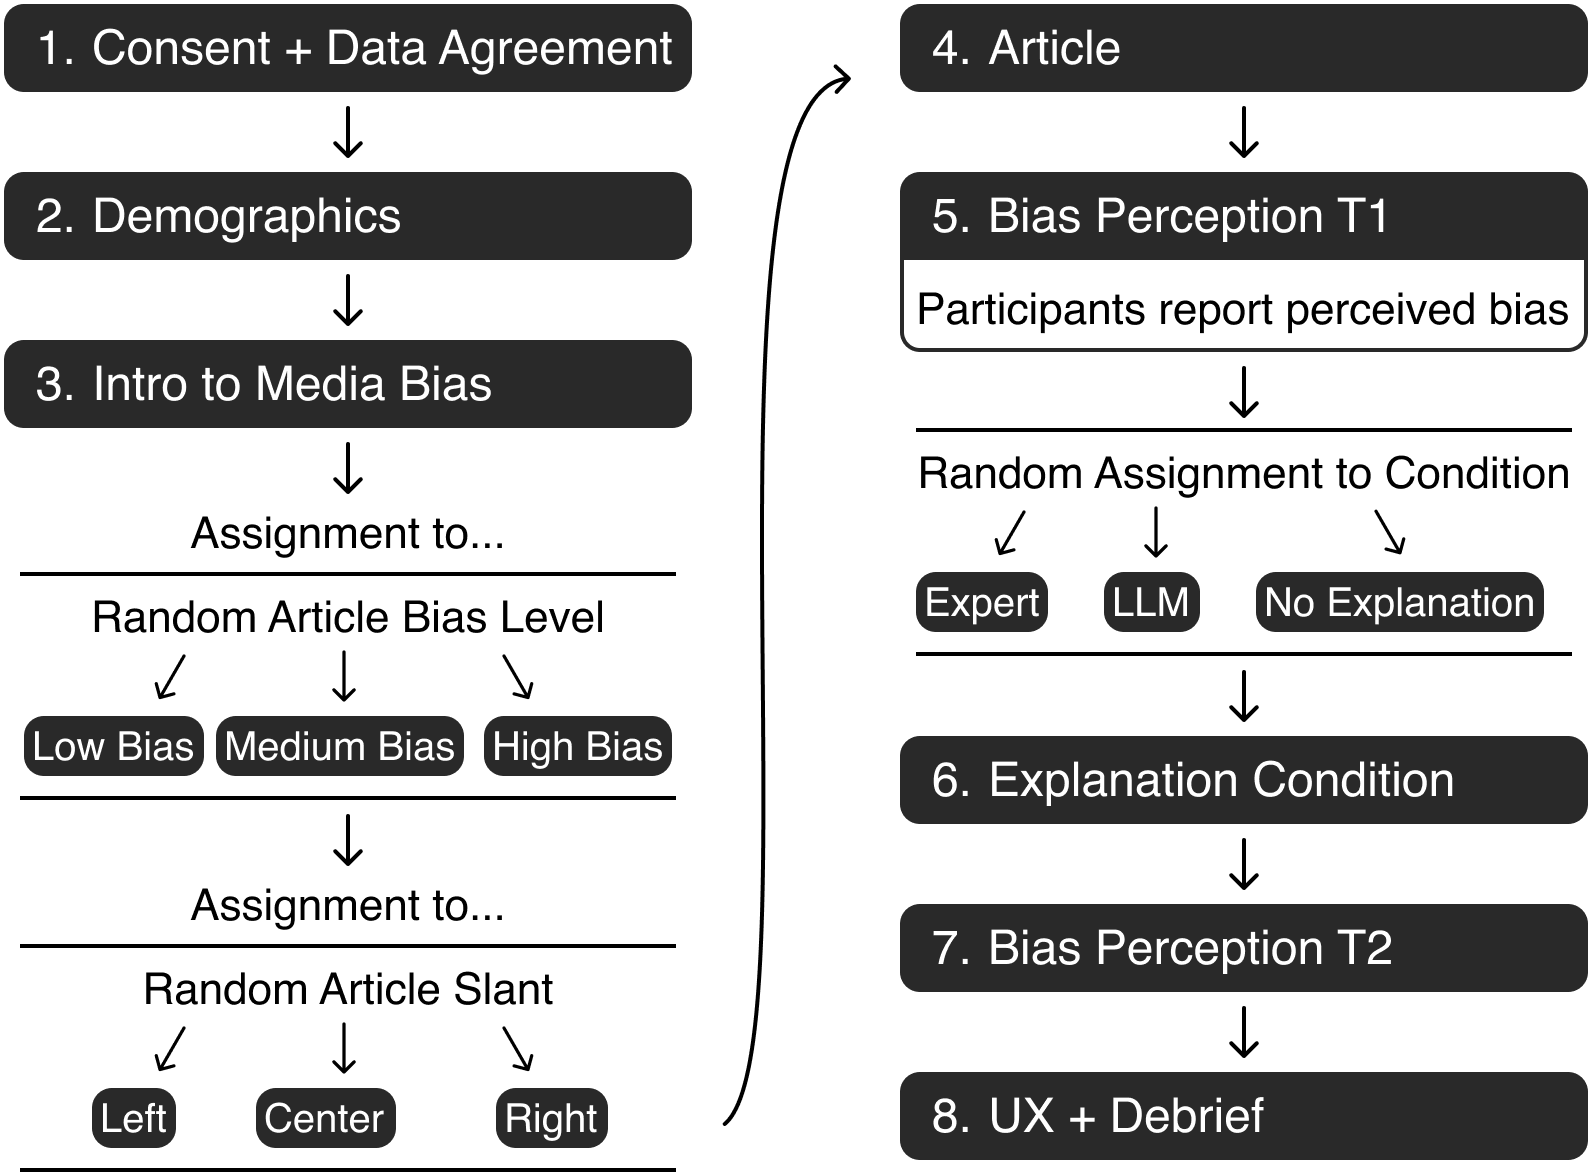
Process of the Study.
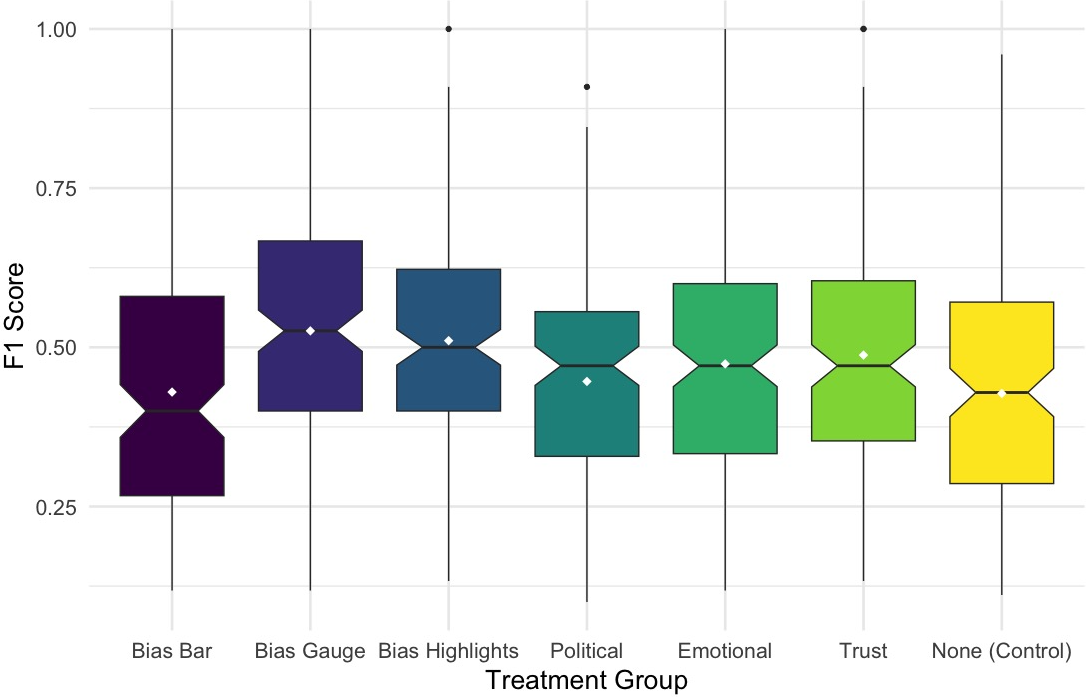
Group Differences in F1 Scores.
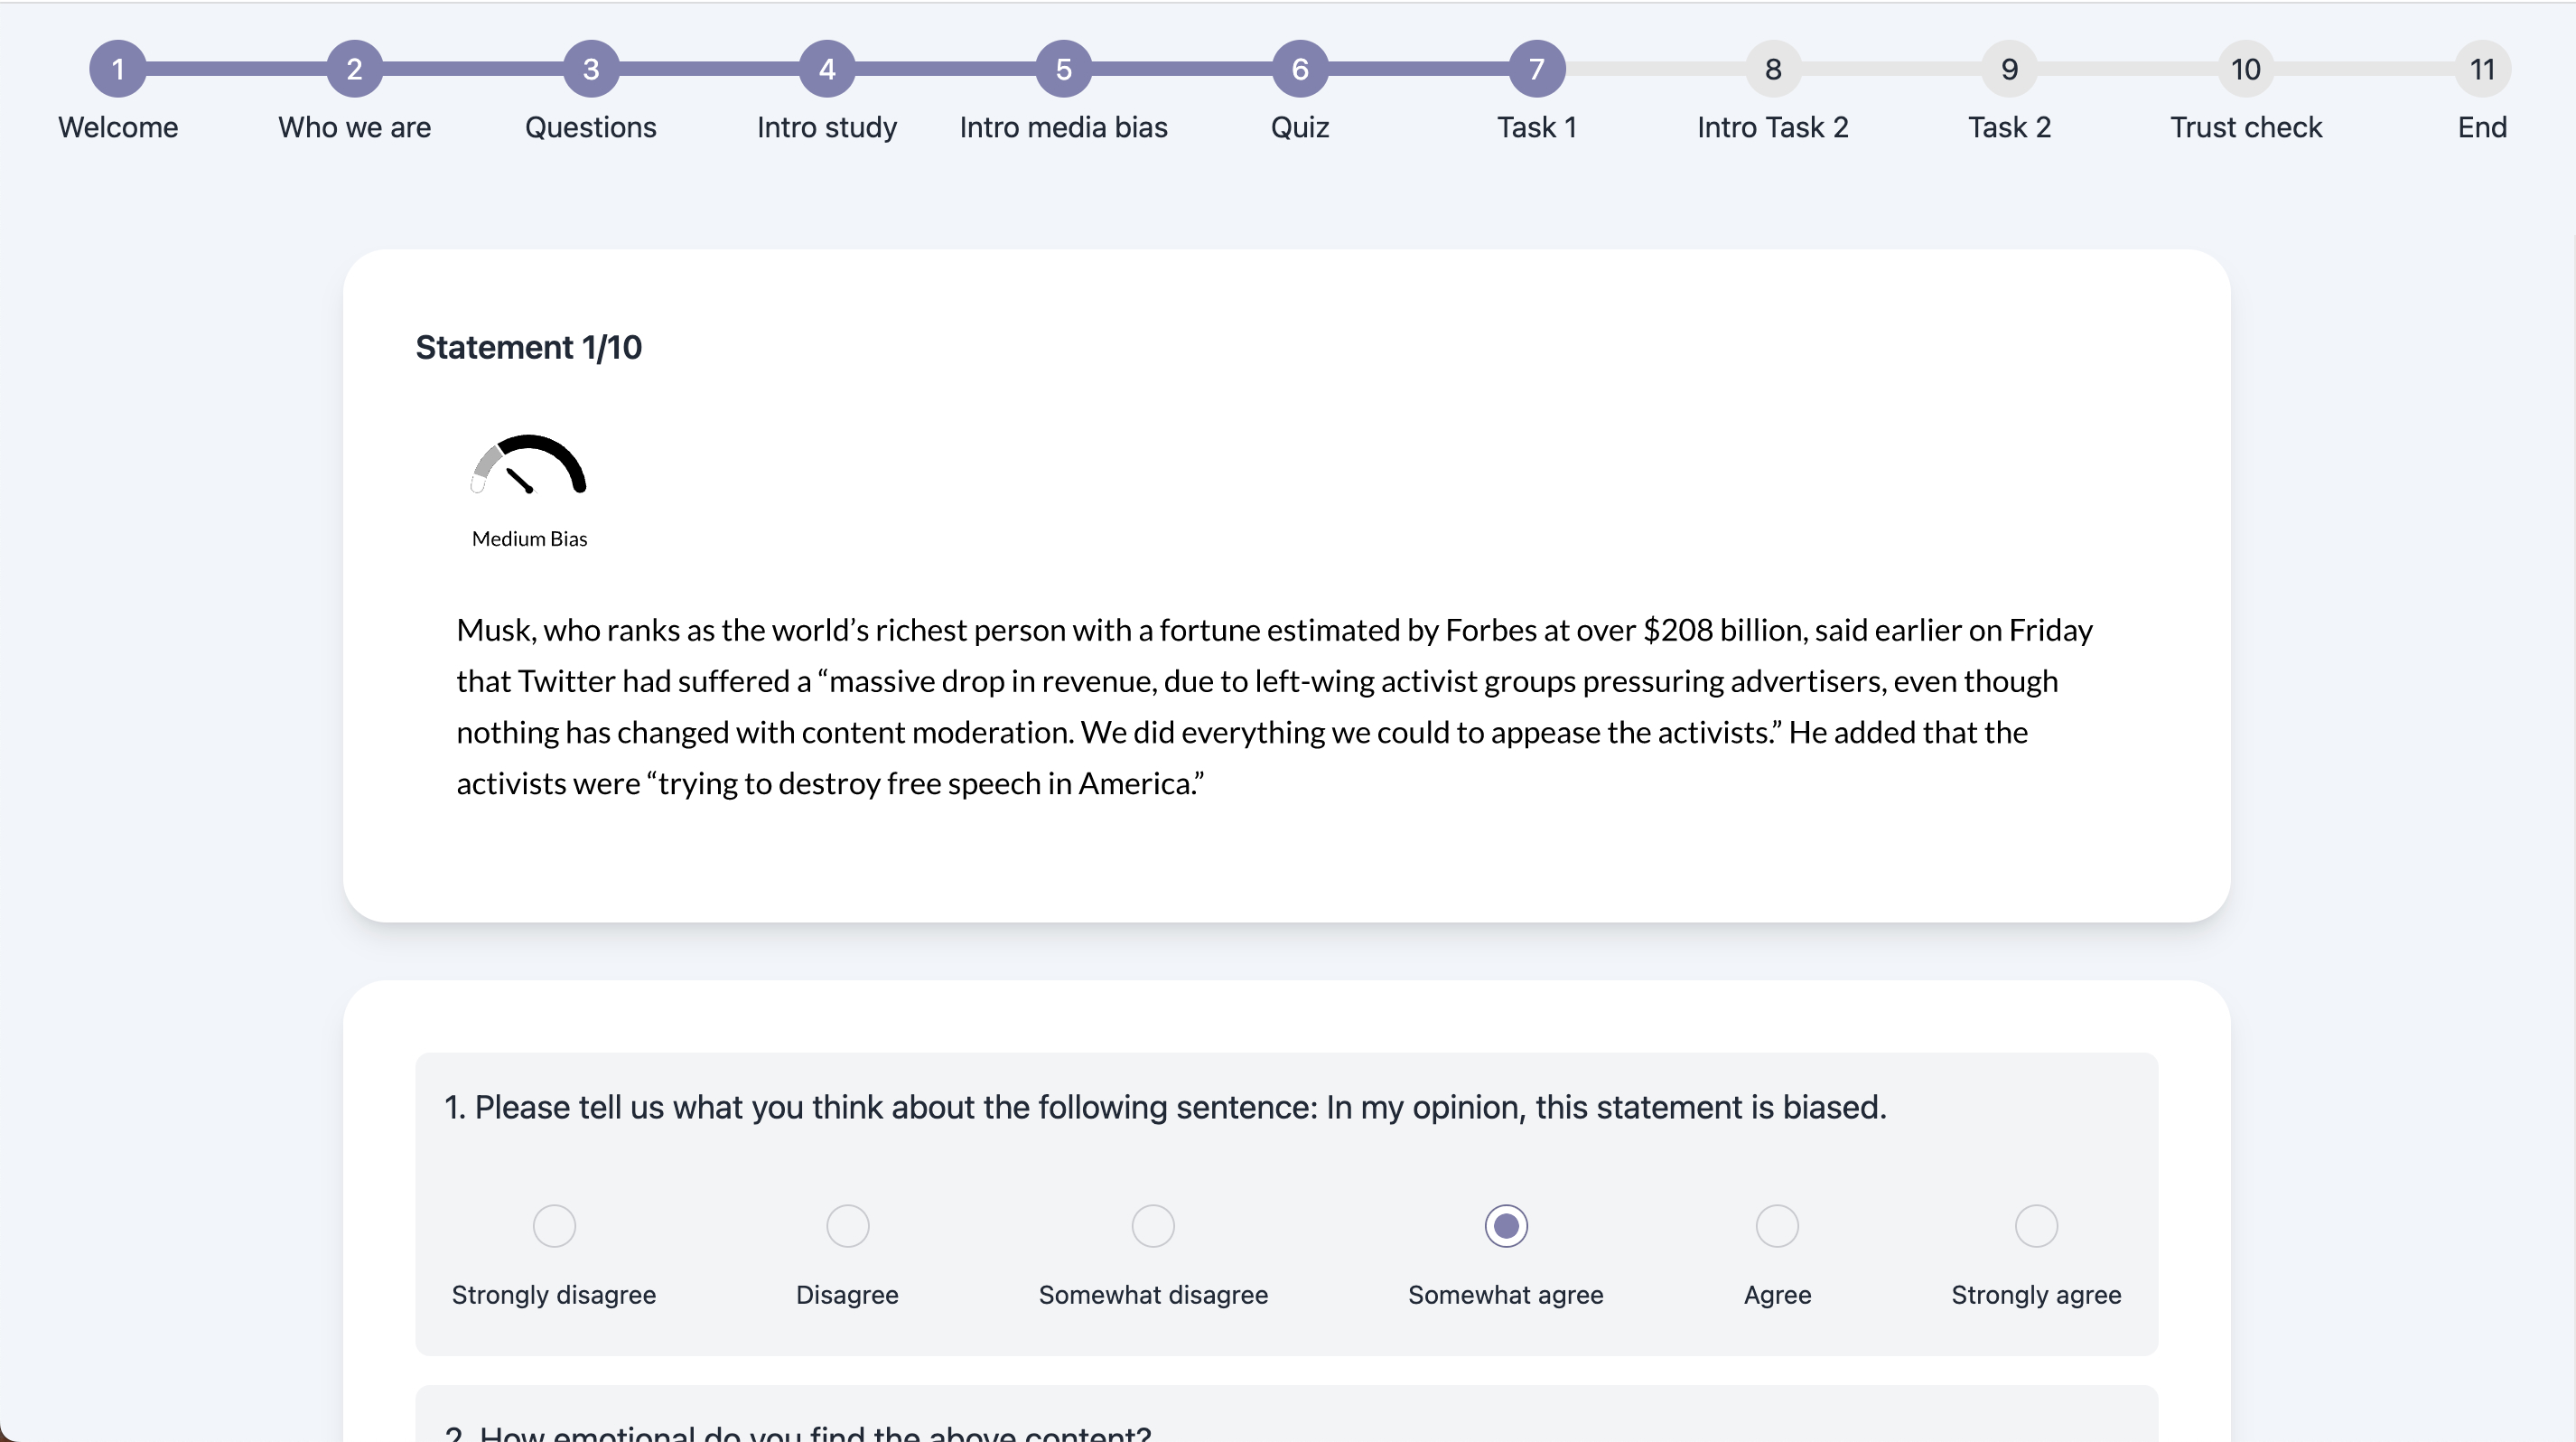
Example of how the indicator Bias Gauge looked like during the study.
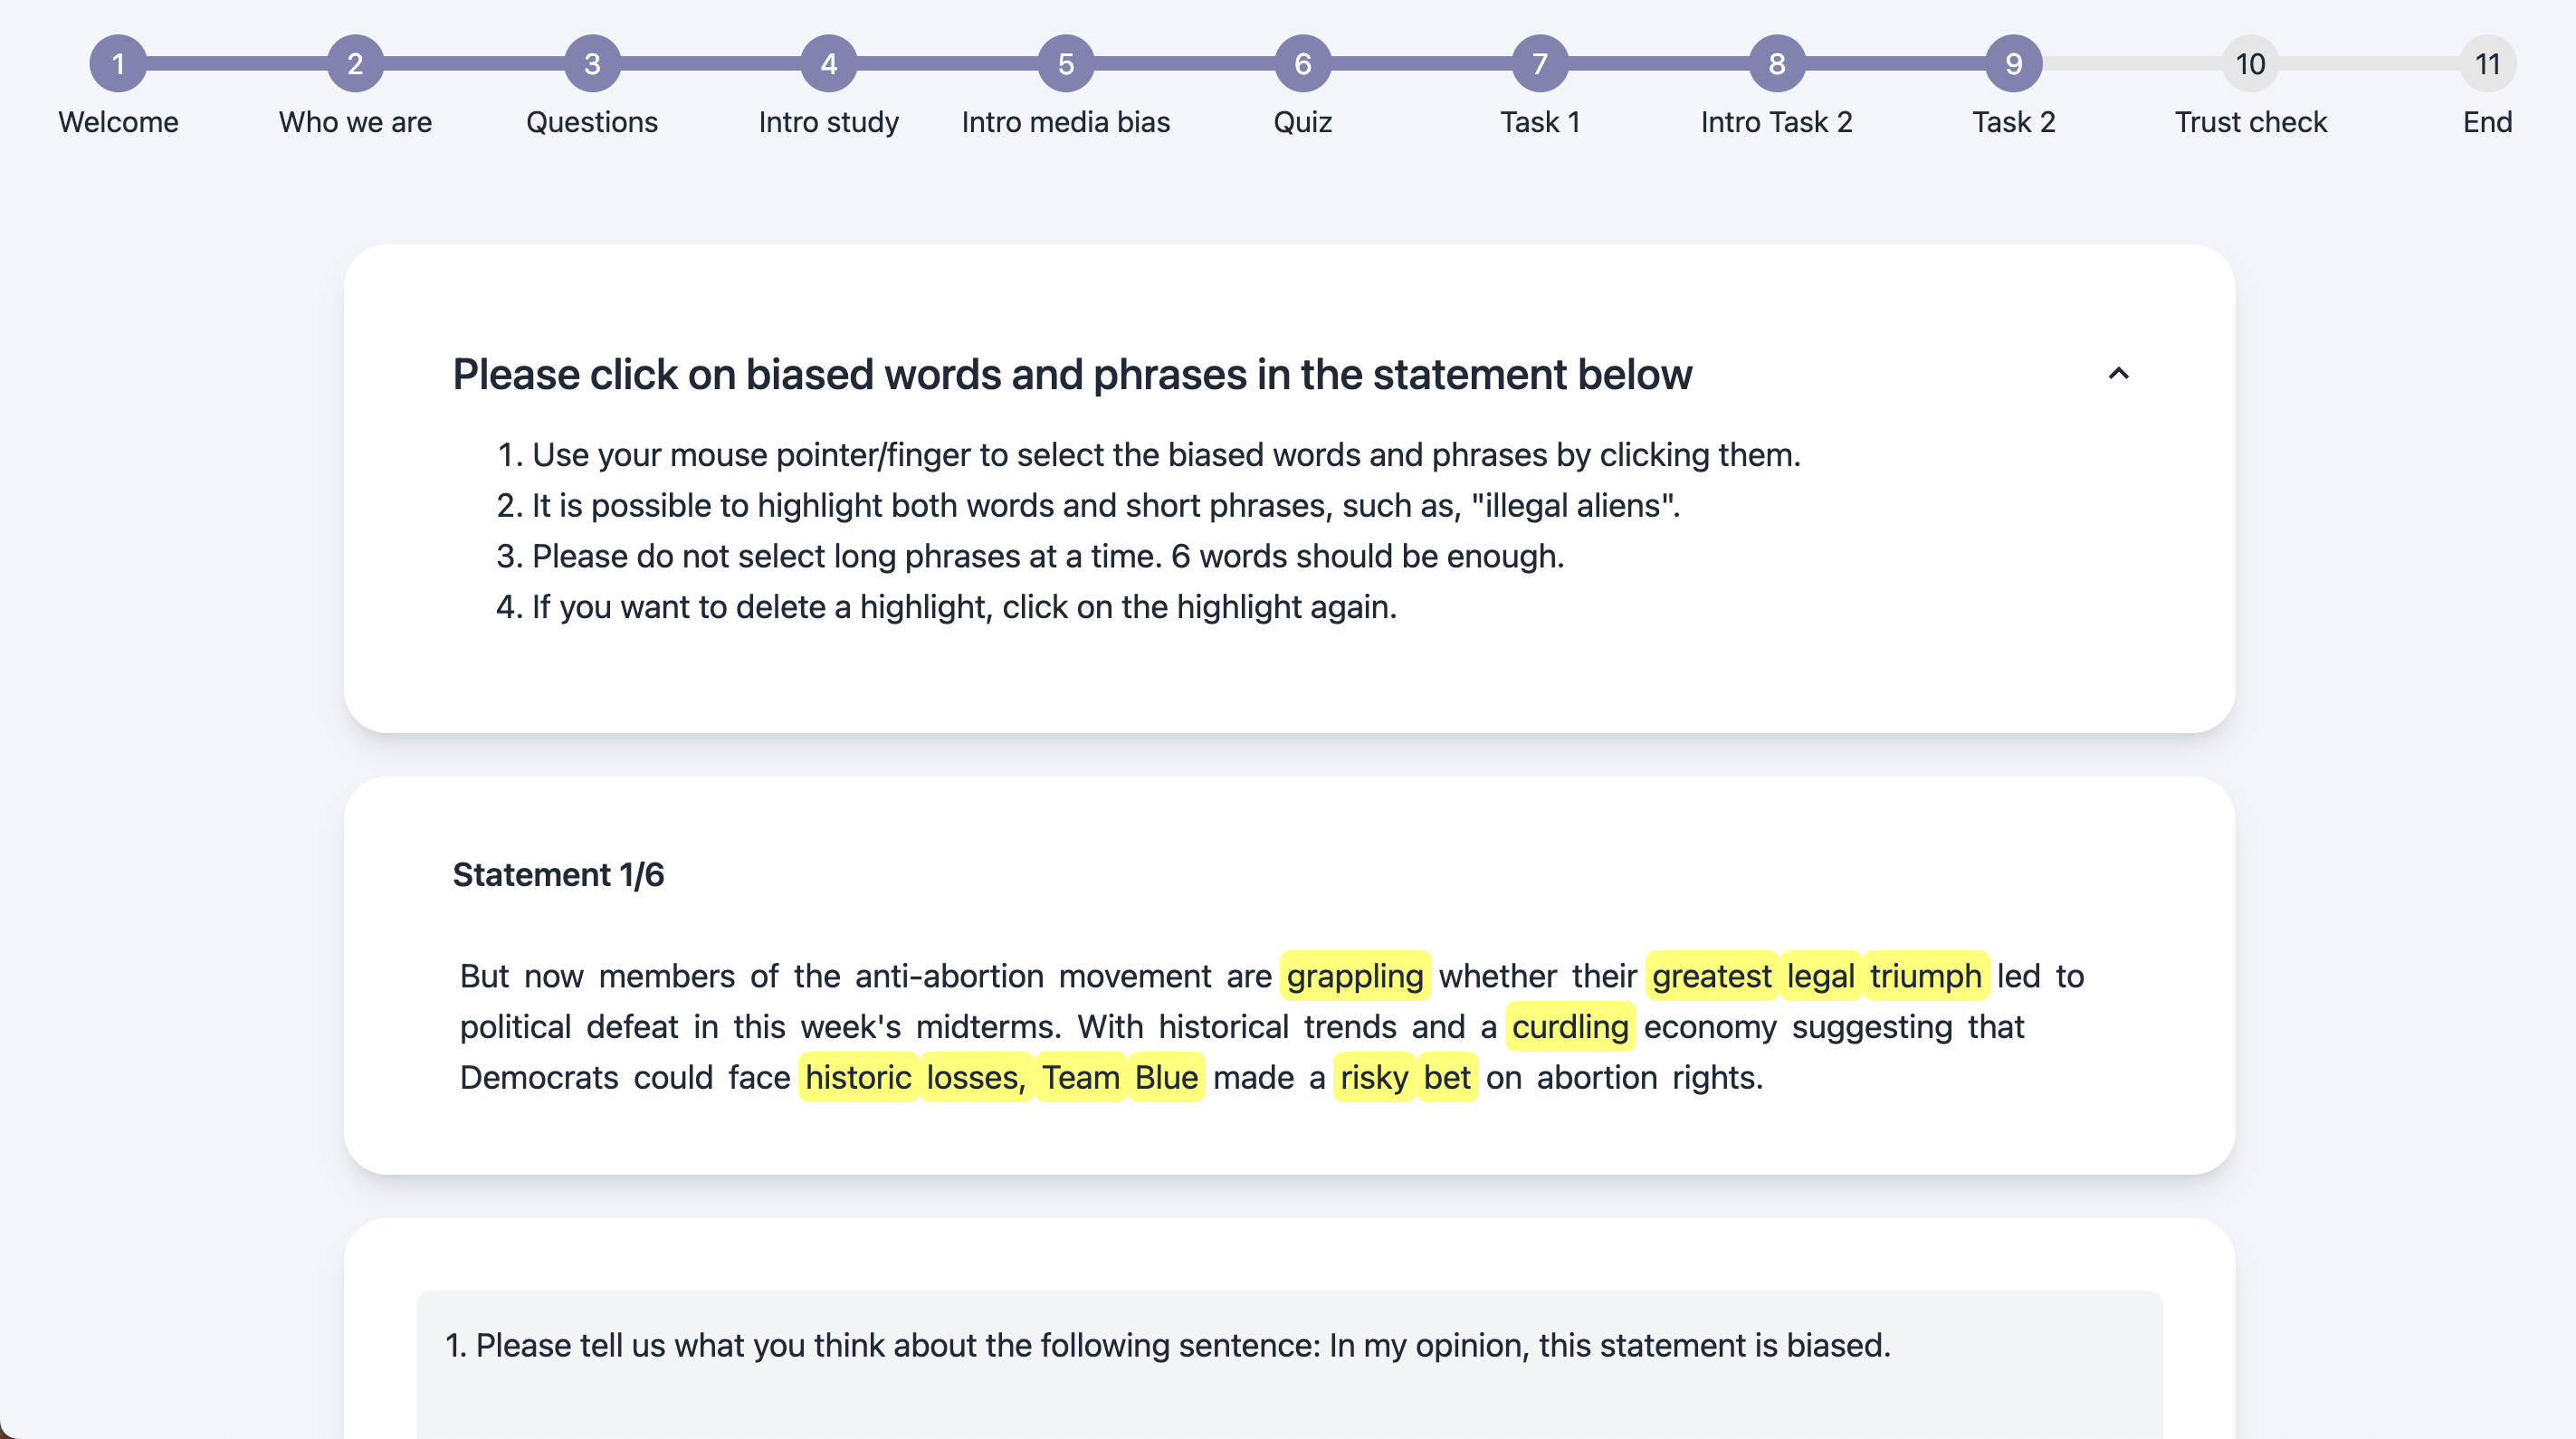
Annotation interface during the testing phase of the study.
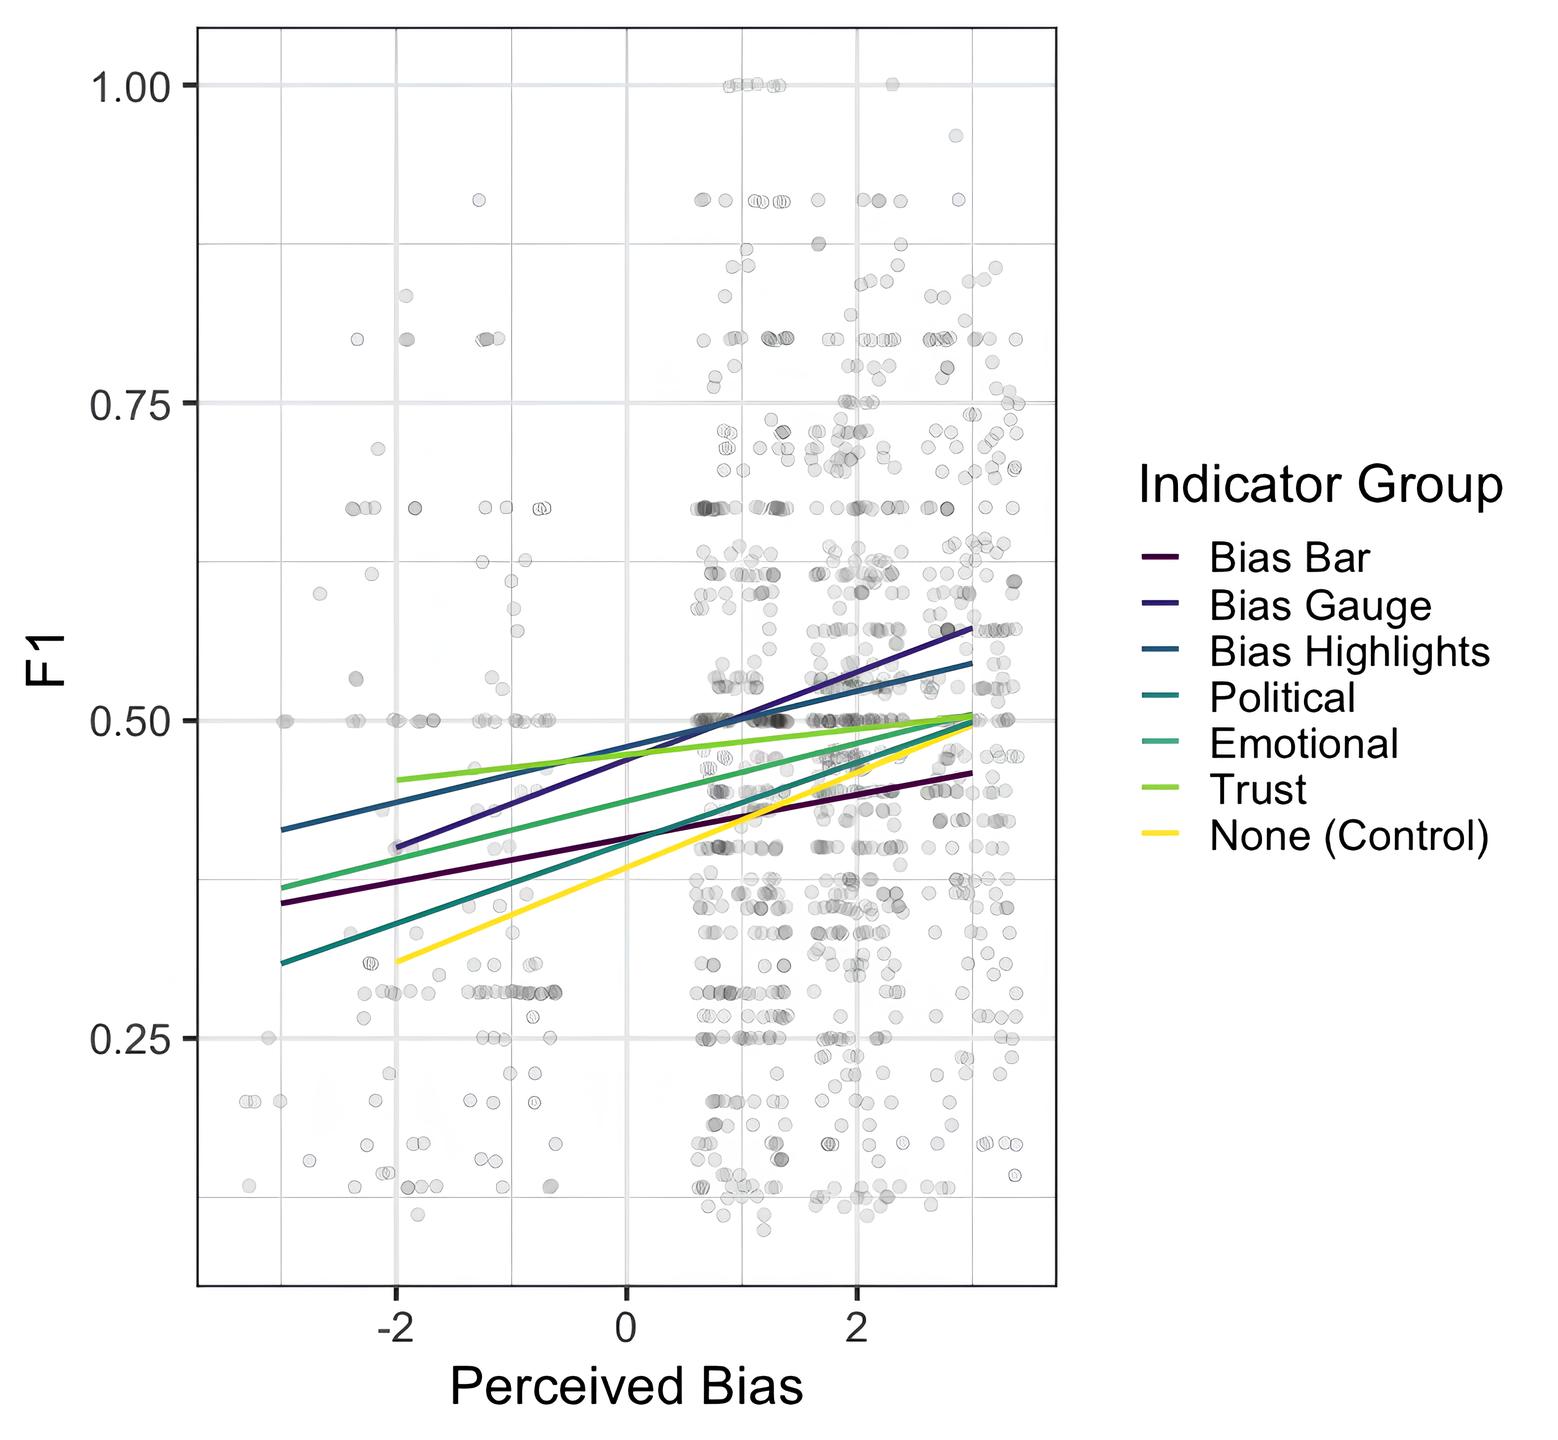
Average F1 scores of each group per perceived bias amount.
Abstract
BibTeX